Process charts are visual representations used to illustrate the sequence of steps or activities in a workflow. They are essential tools in various industries, including manufacturing, project management, and business process optimization. Understanding how to create and interpret process charts can streamline operations, enhance efficiency, and improve communication within an organization.
In this comprehensive guide, we will explore the different types of process charts, their benefits, and how to effectively utilize them in your workflow.
What is a Process Chart?
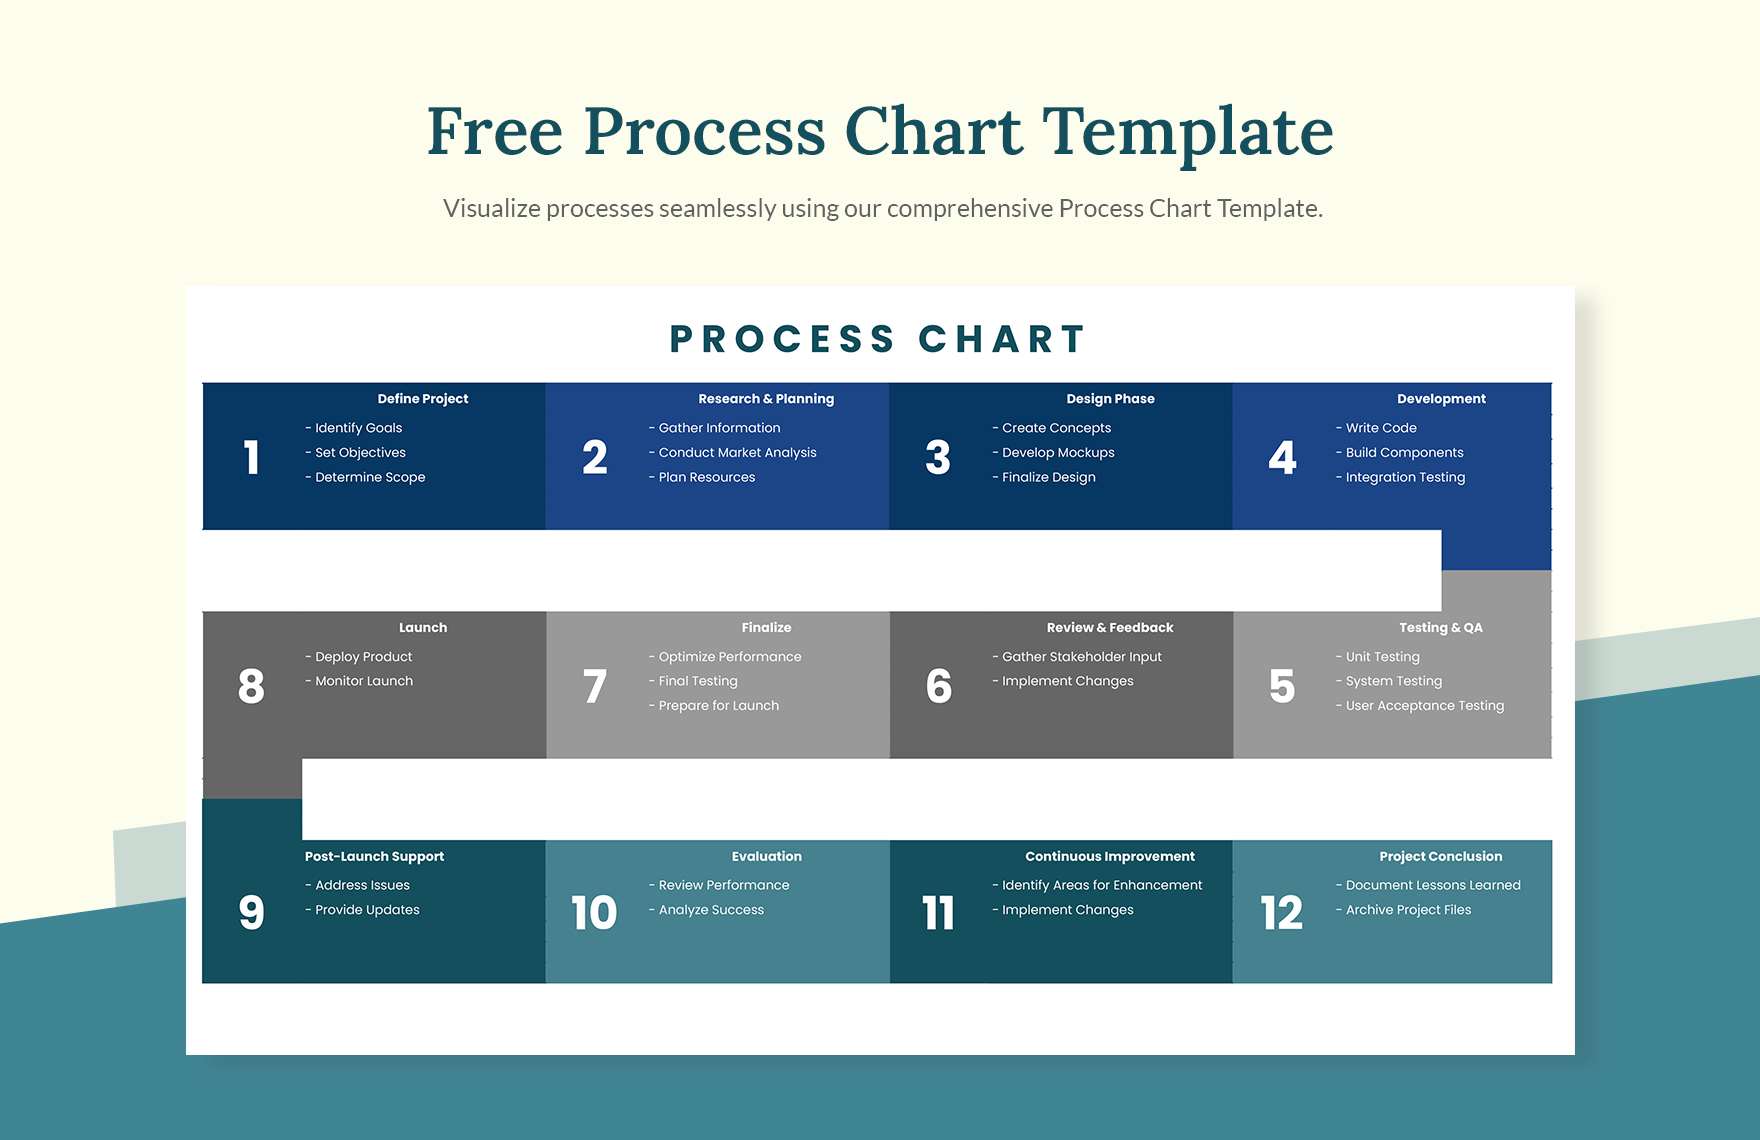
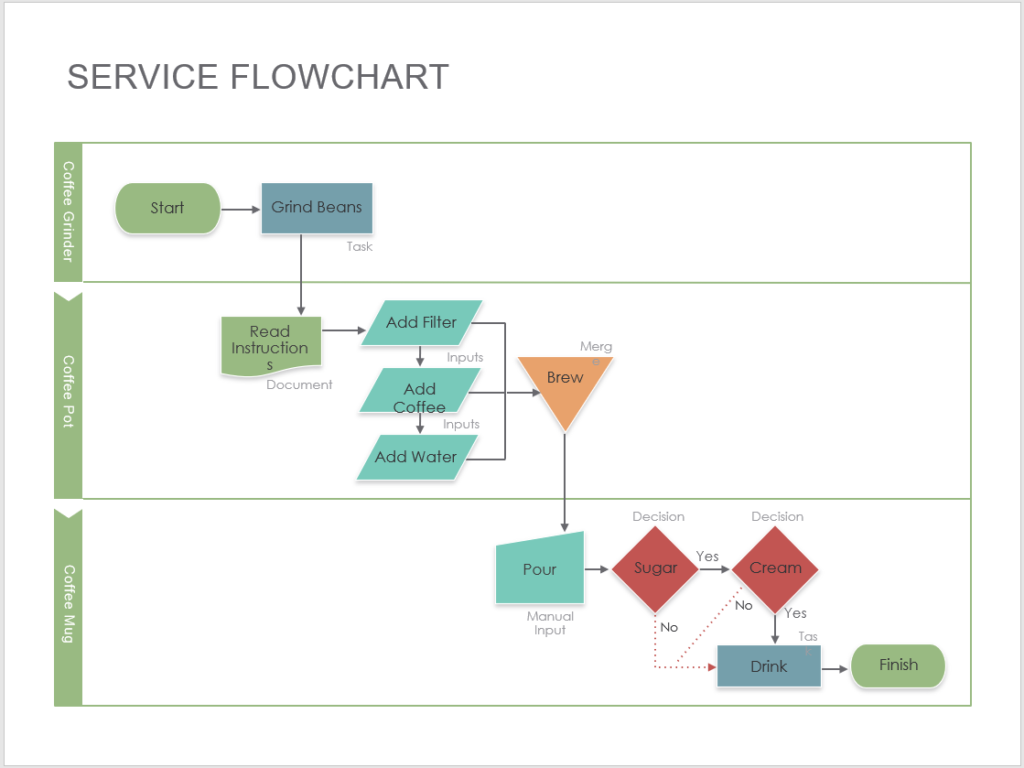
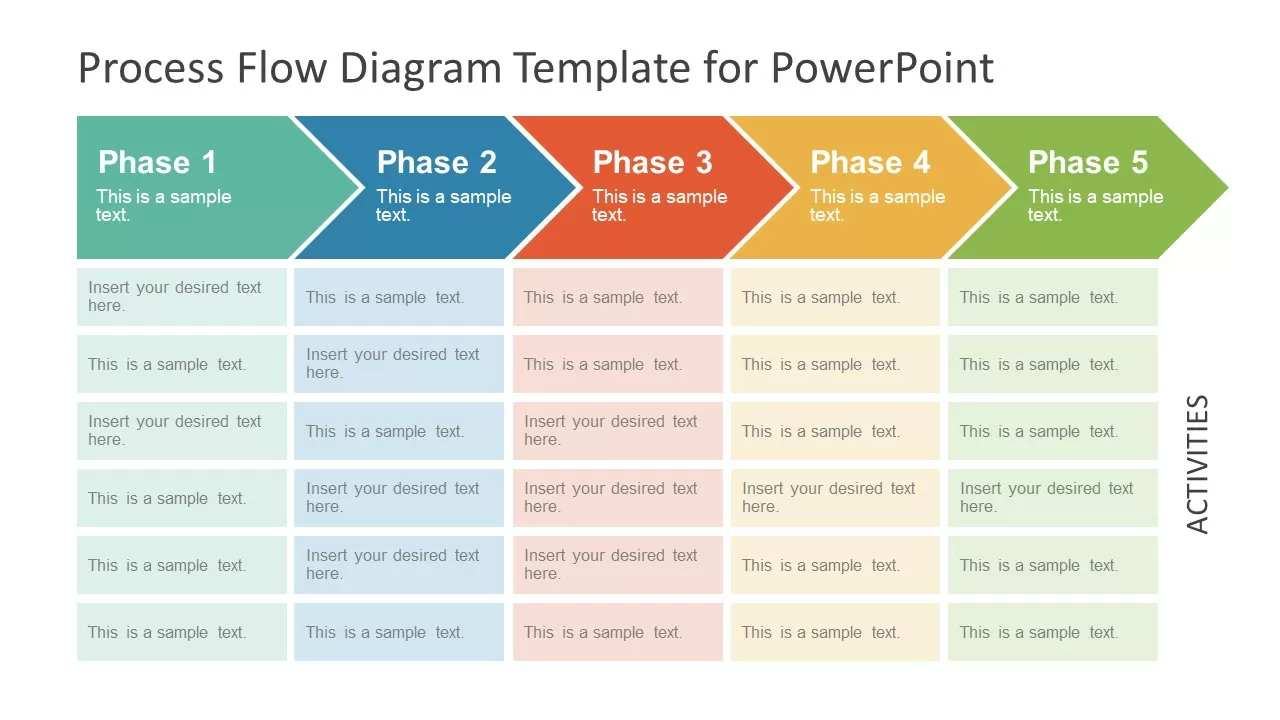
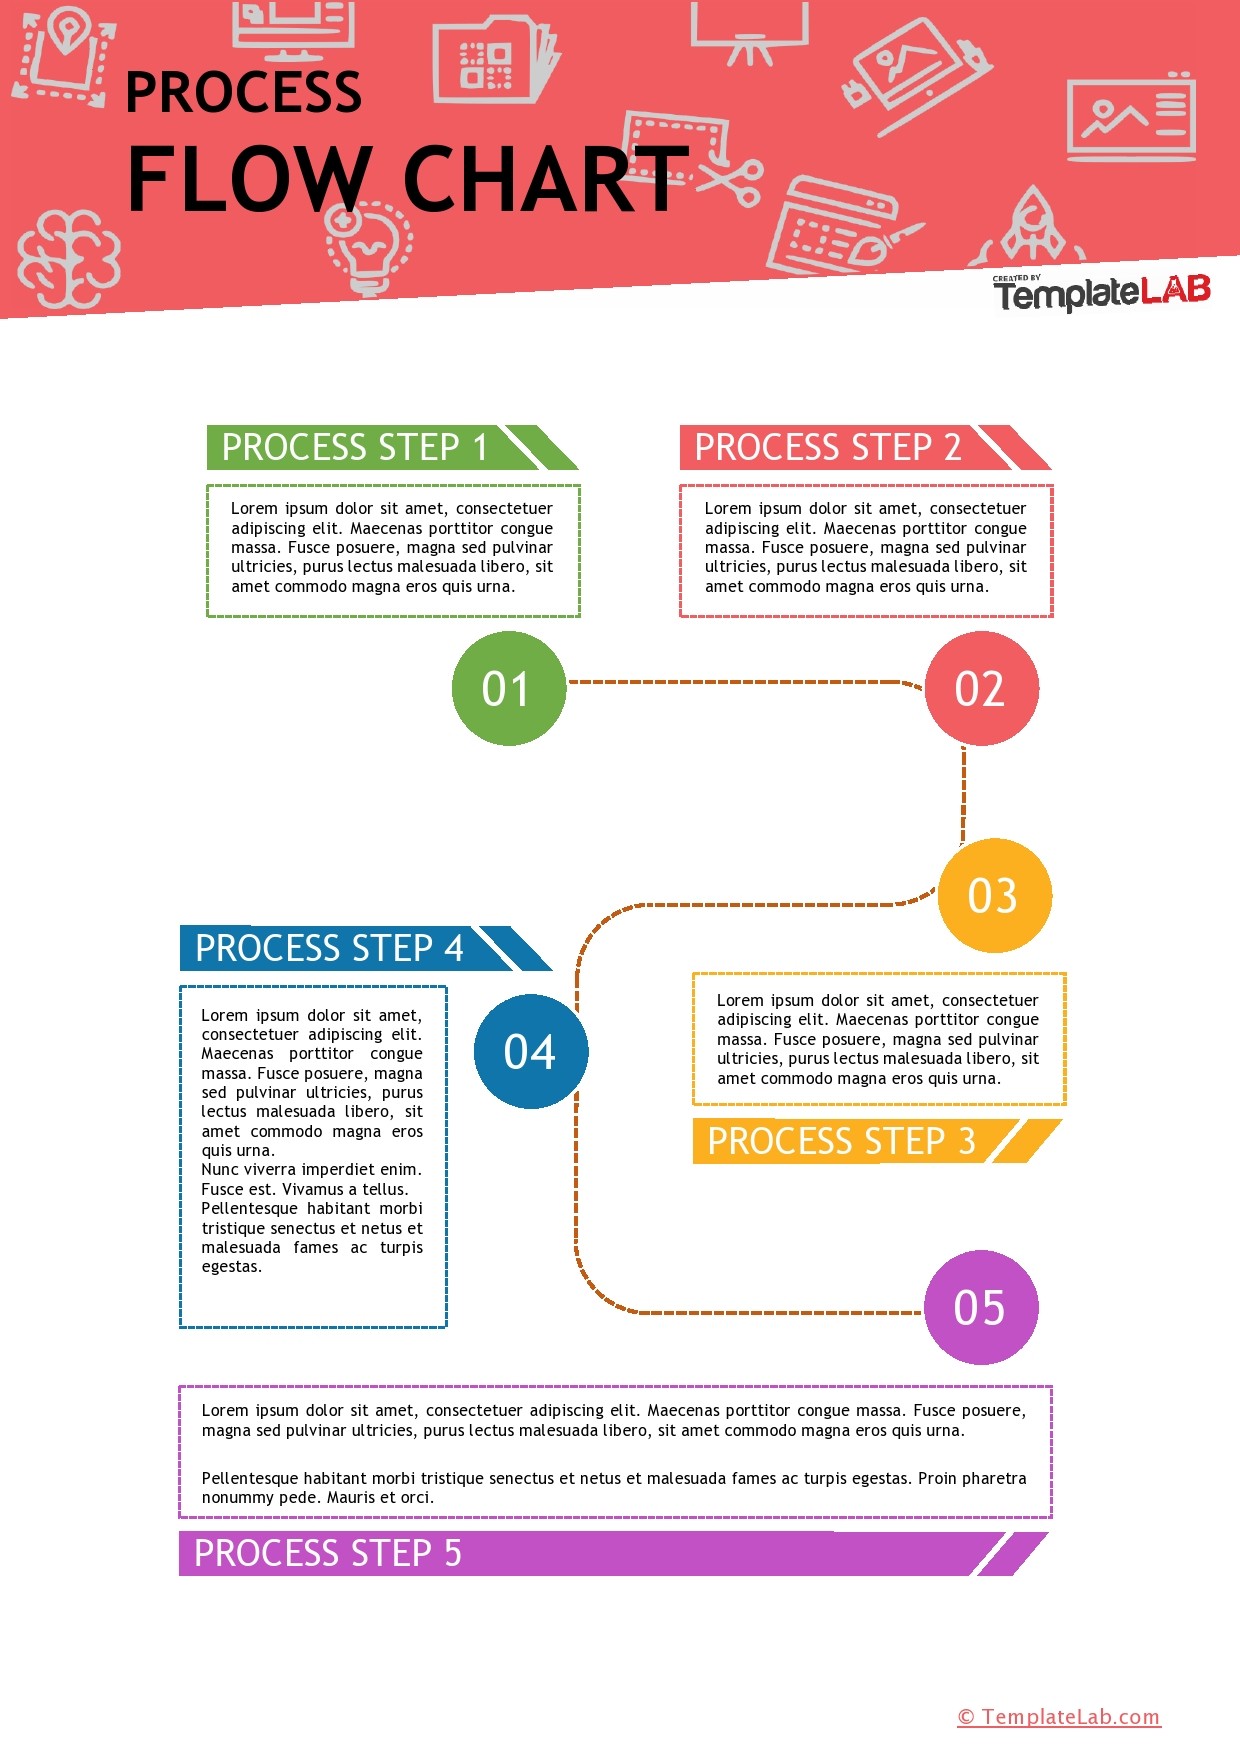
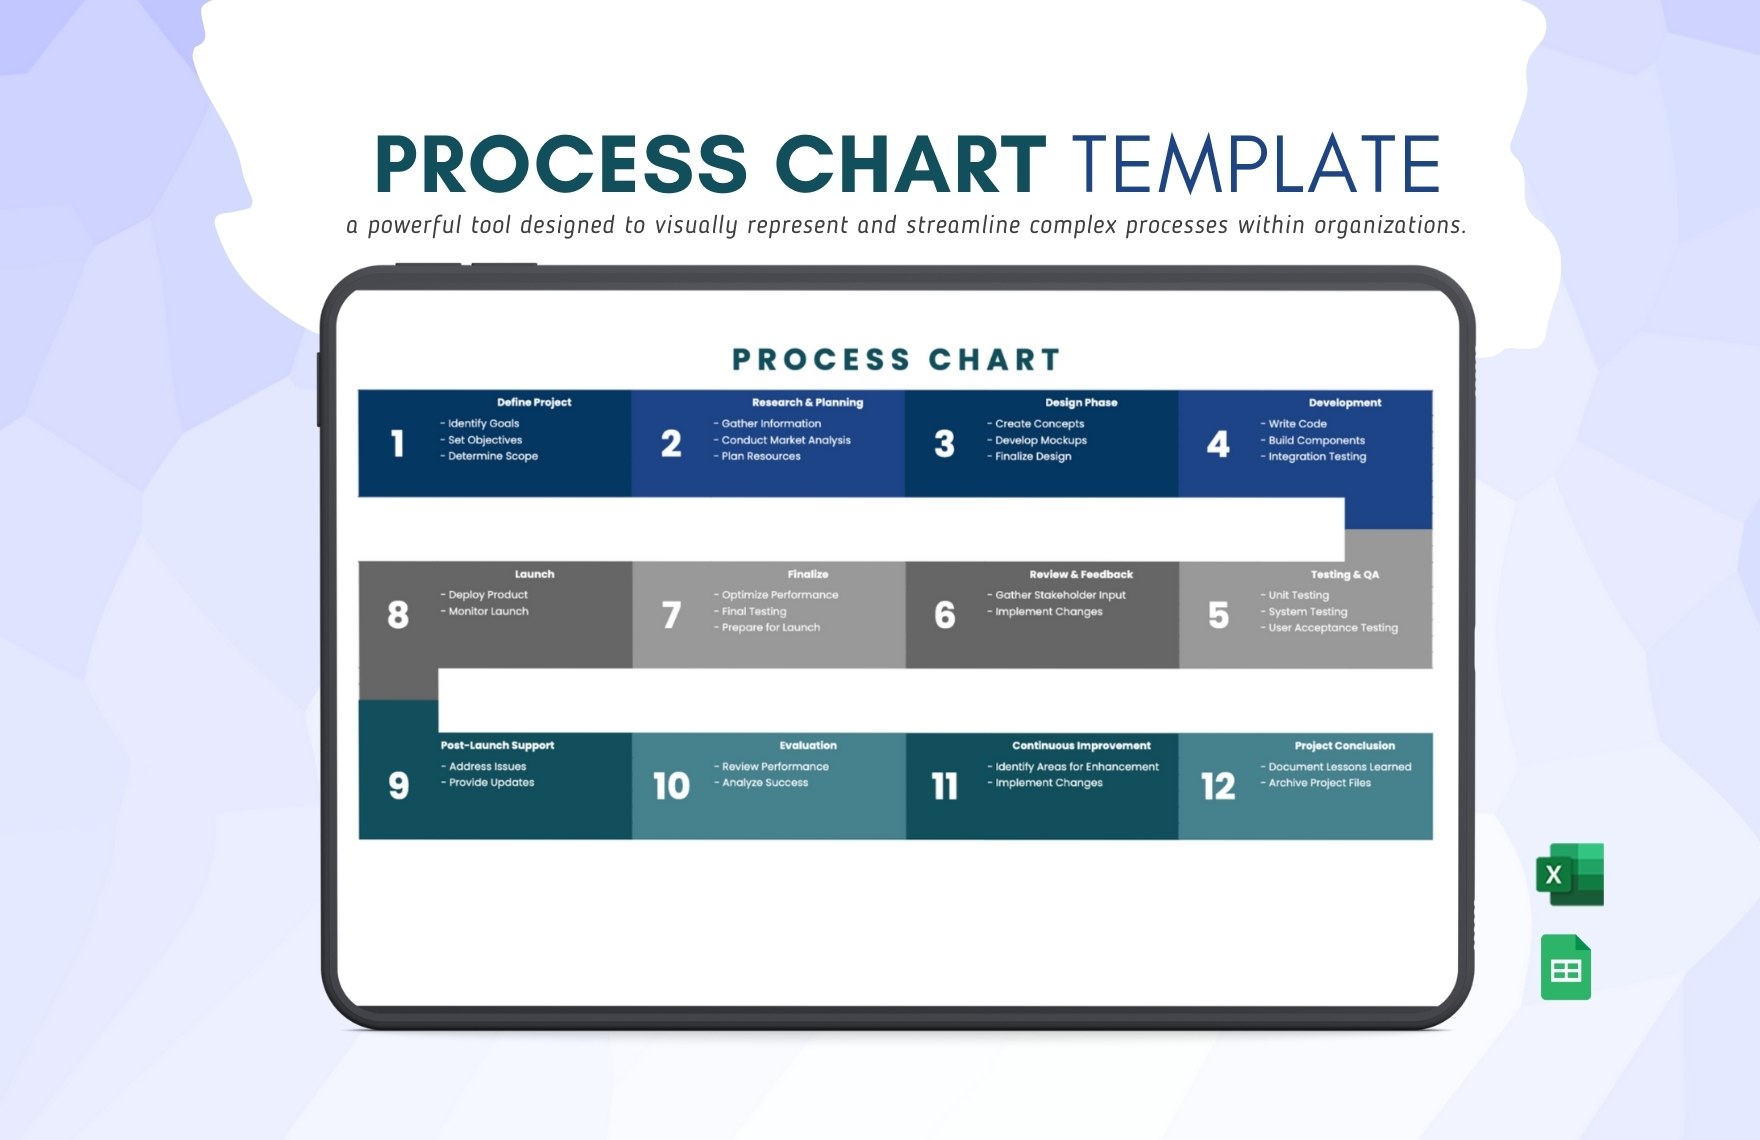
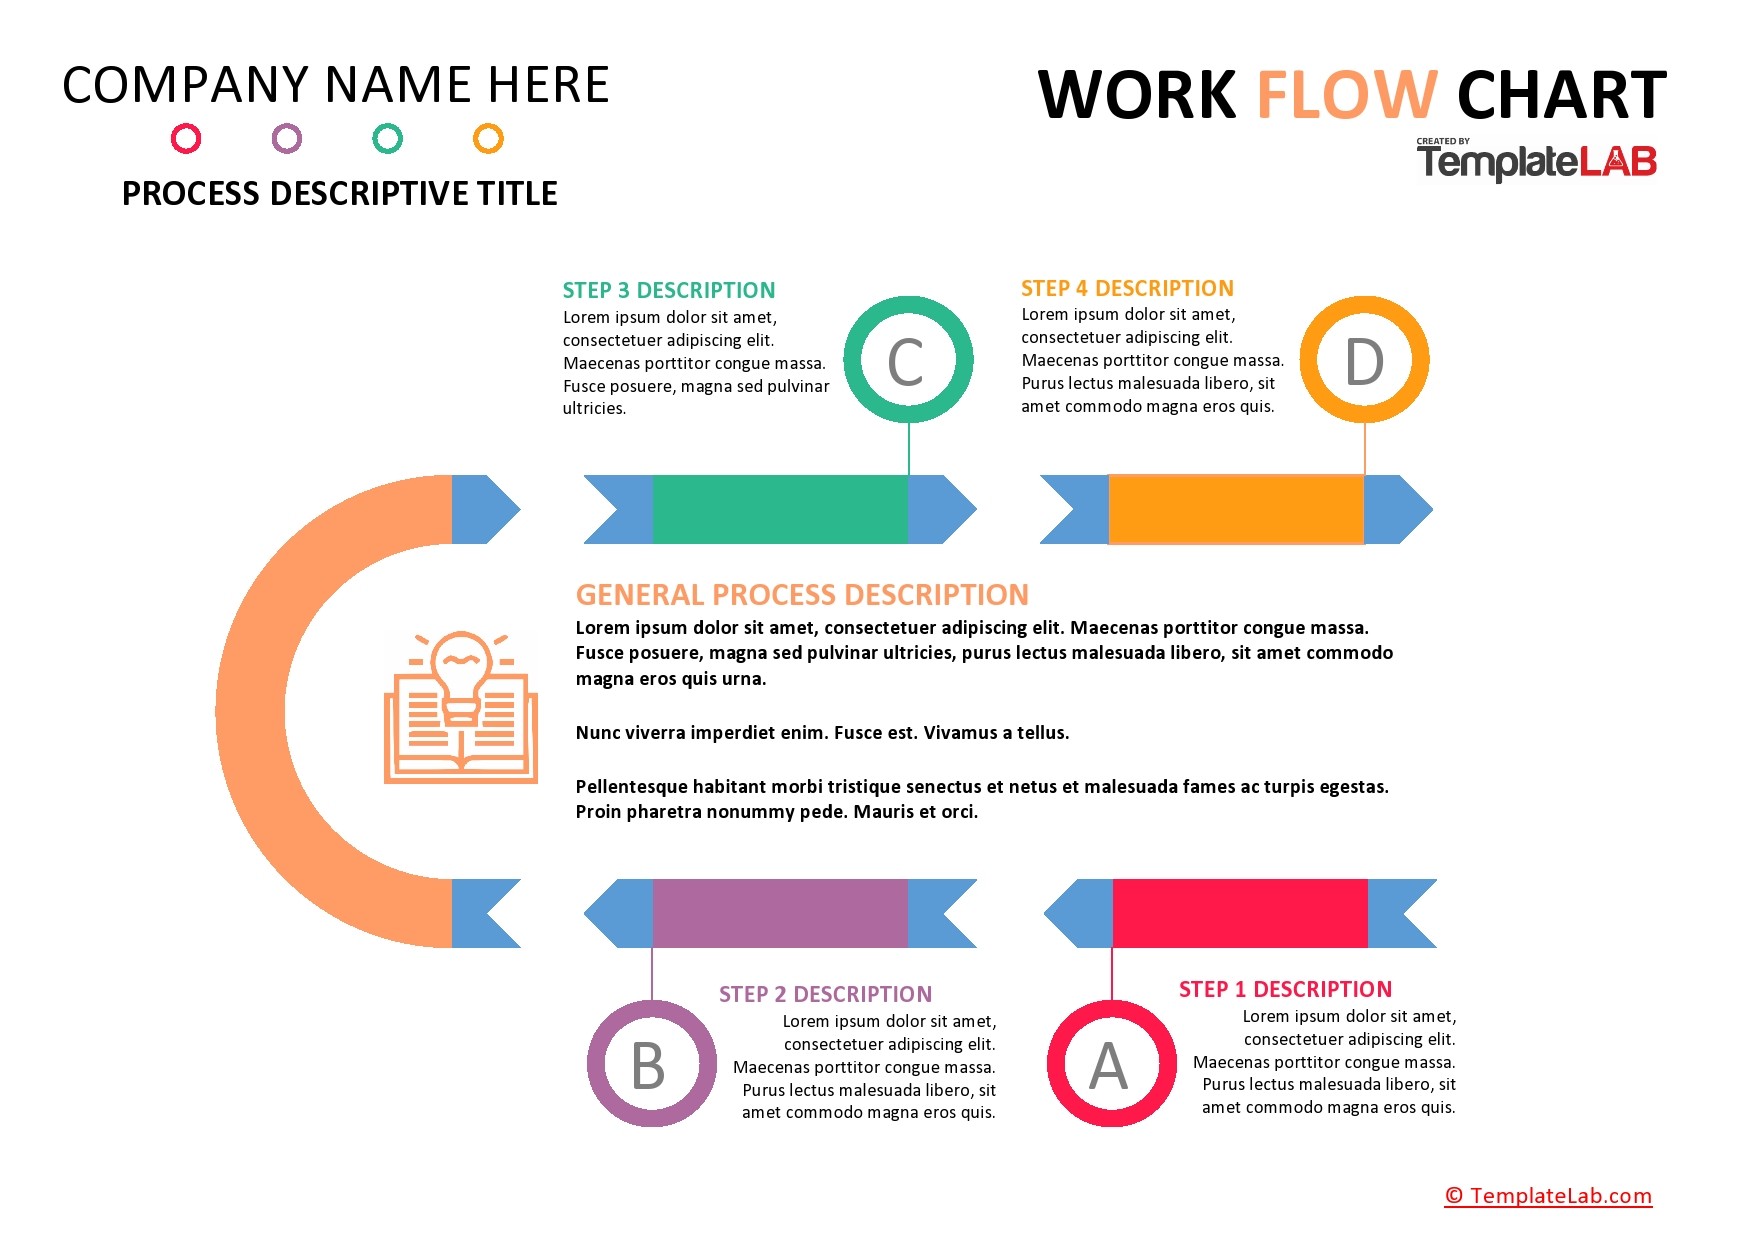
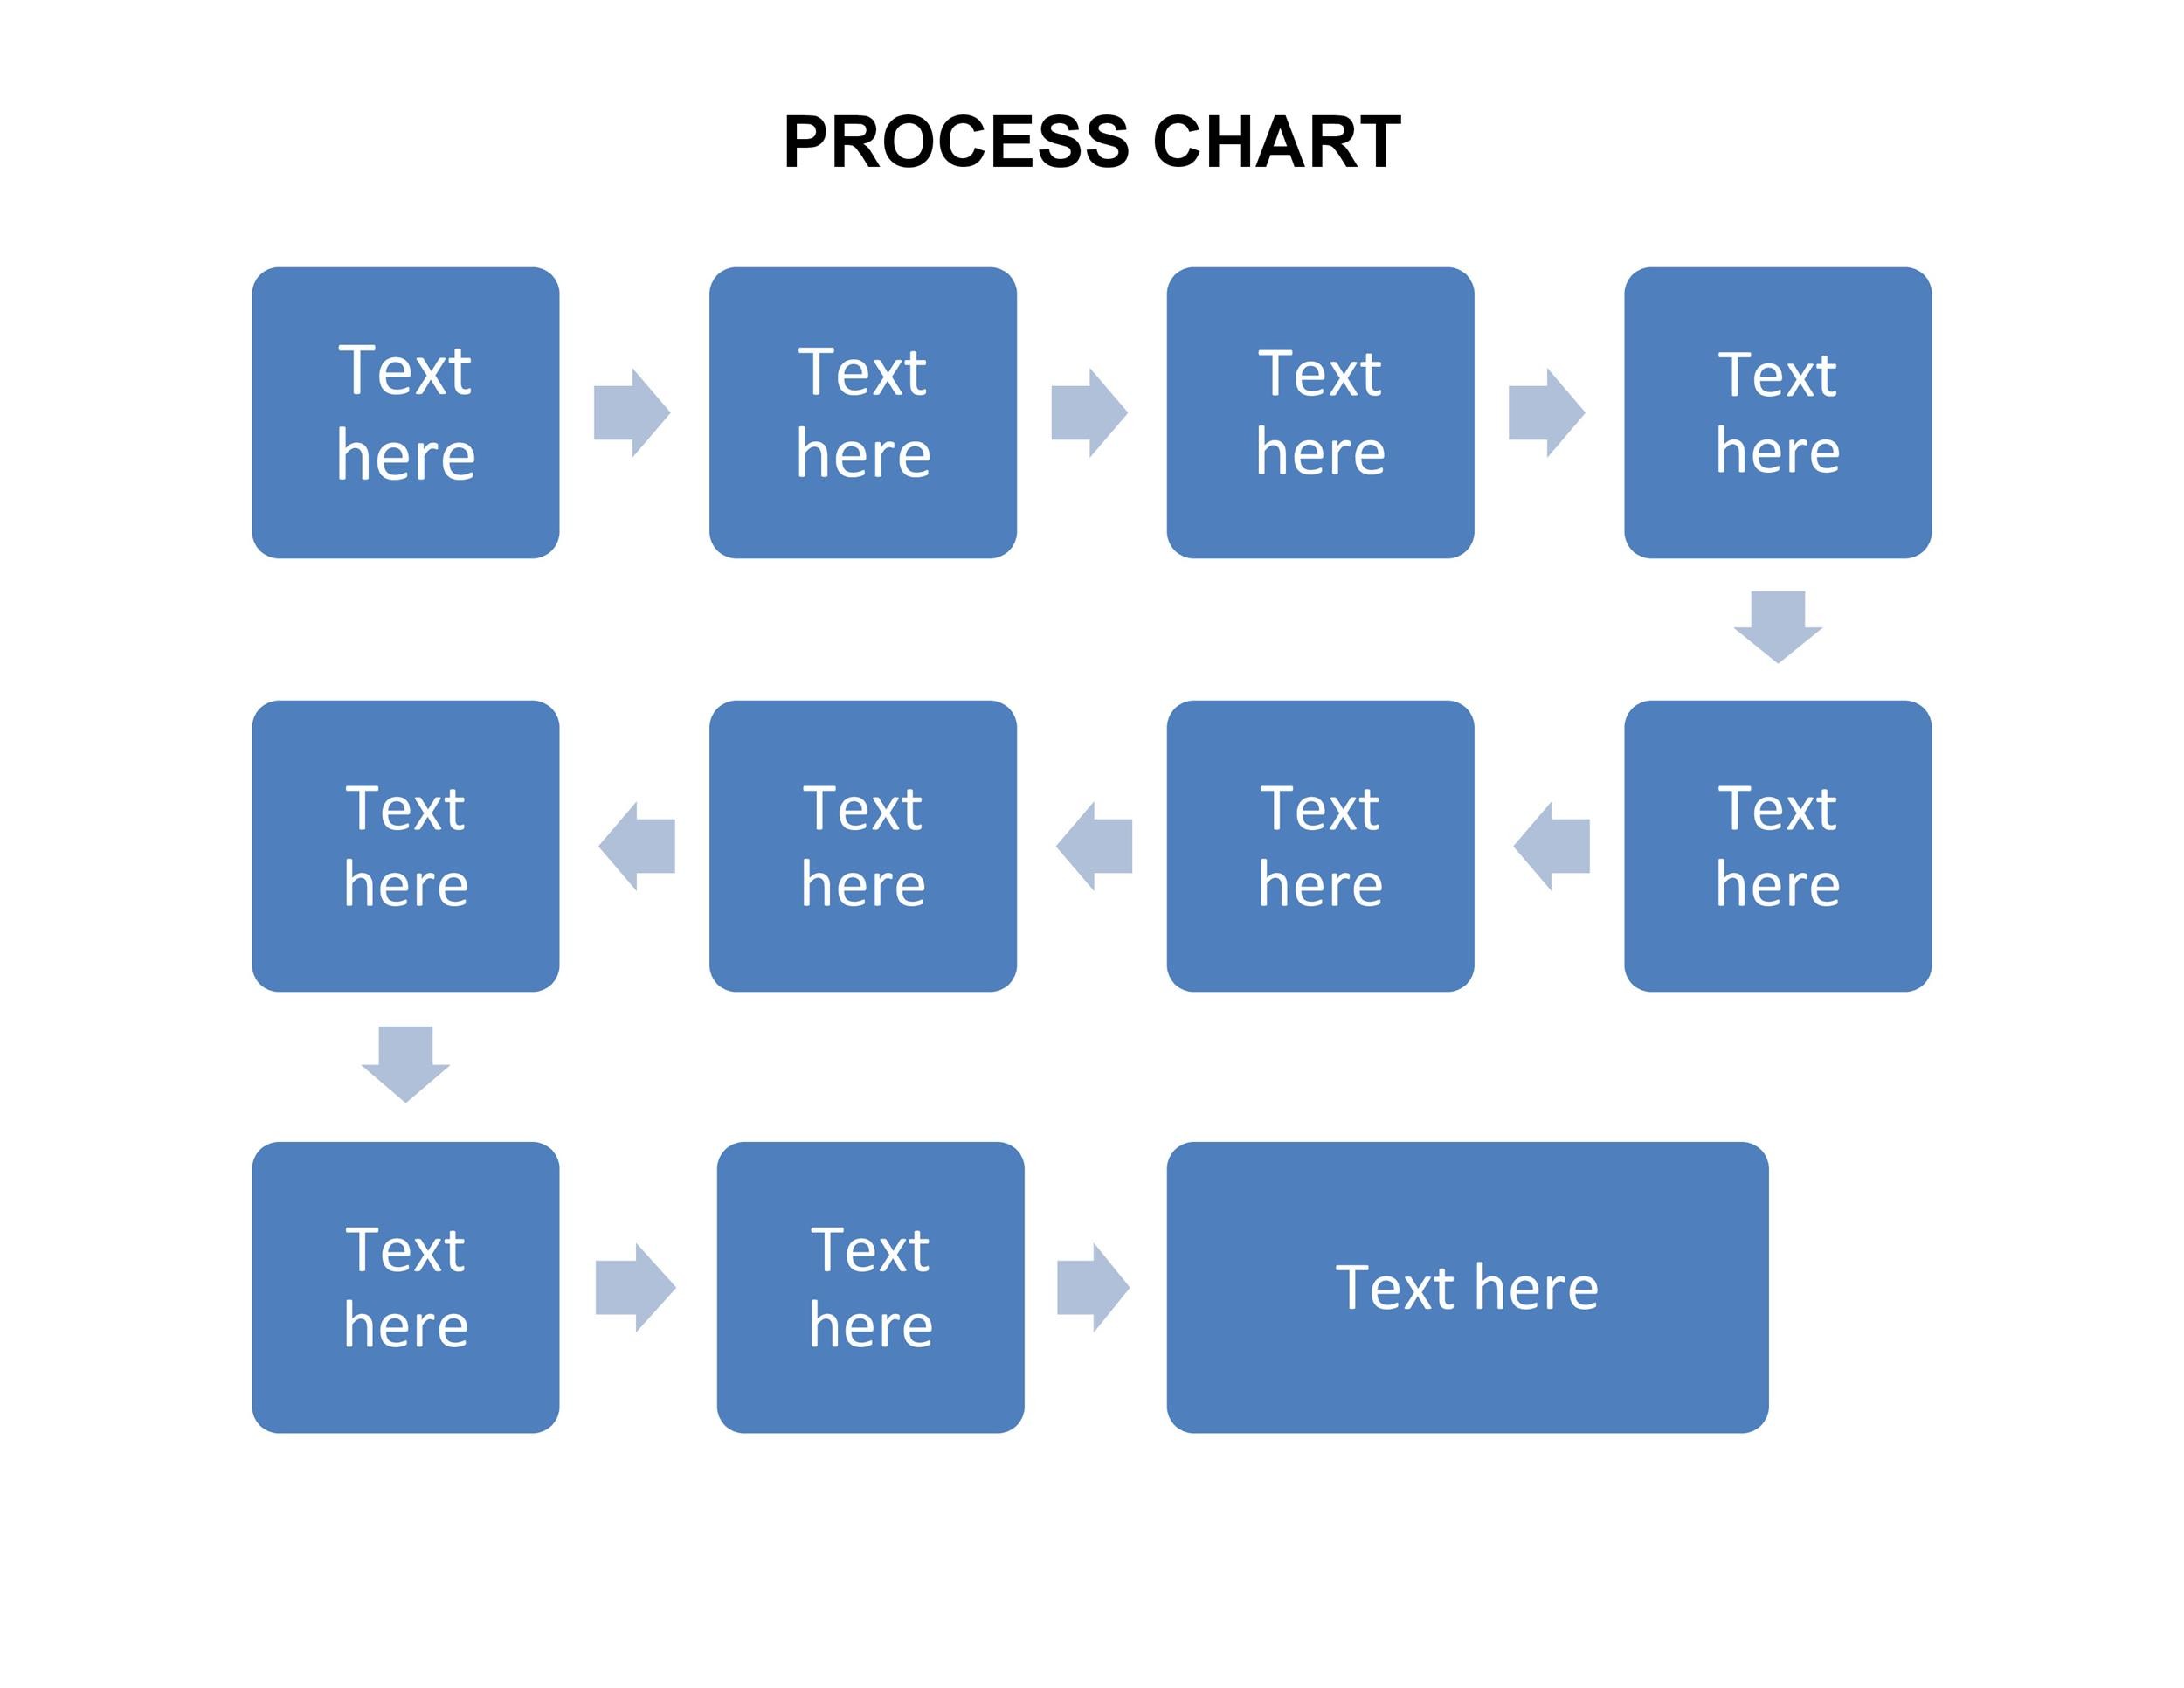
A process chart is a graphical representation of a series of steps or activities in a workflow. It provides a clear and concise overview of the sequence of tasks involved in a process, highlighting dependencies, decision points, and potential bottlenecks. Process charts come in various forms, such as flowcharts, swimlane diagrams, Gantt charts, and timeline charts, each serving a specific purpose in visualizing different aspects of a process.
When creating a process chart, it is crucial to consider the audience and the level of detail required. A high-level overview may be sufficient for executive presentations, while detailed flowcharts are more suitable for process optimization and implementation. Regardless of the type of process chart used, the goal is to enhance understanding, facilitate communication, and improve decision-making within an organization.
Why Use Process Charts?
Process charts offer numerous benefits for organizations looking to streamline operations, improve efficiency, and drive continuous improvement. Some of the key advantages of using process charts include:
- Clarity: Process charts provide a visual representation of complex processes, making it easier to understand the sequence of tasks and dependencies.
- Communication: Process charts facilitate communication and collaboration among team members, ensuring everyone is on the same page regarding the workflow.
- Identifying Bottlenecks: By visualizing the process flow, organizations can identify bottlenecks, inefficiencies, and areas for improvement.
- Standardization: Process charts help standardize procedures and ensure consistency in operations, leading to higher quality outputs.
- Decision-Making: Process charts enable data-driven decision-making by providing a clear overview of the steps involved in a process.
Overall, process charts play a crucial role in enhancing operational efficiency, optimizing workflows, and driving organizational success.
What to Include in a Process Chart
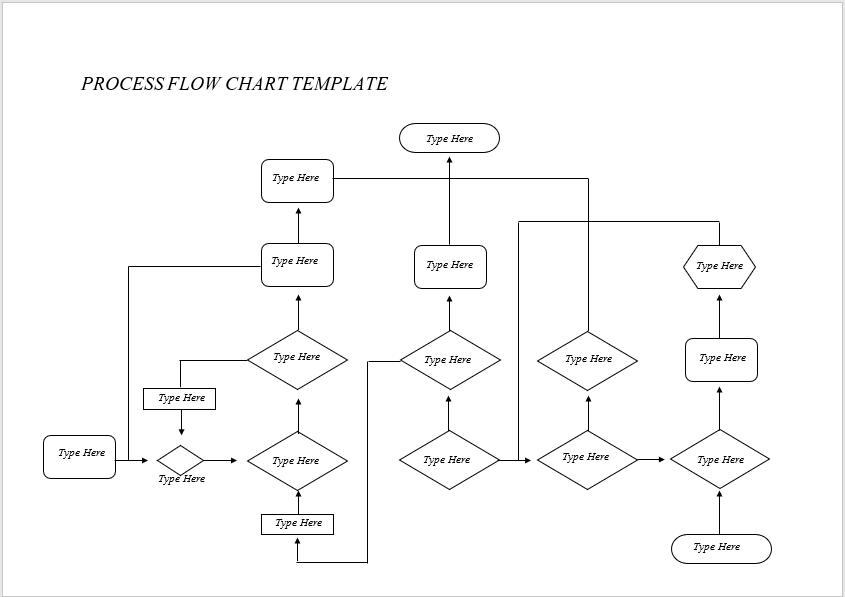
When creating a process chart, there are several key elements to include to ensure clarity and effectiveness. These elements help convey the sequence of tasks, decision points, and dependencies within a process. Some essential components to include in a process chart are:
- Start and End Points: Clearly indicate where the process starts and ends to provide context for the workflow.
- Tasks or Activities: List the tasks or activities involved in the process in a sequential order, highlighting dependencies and relationships.
- Decision Points: Identify decision points where choices need to be made, branching the flowchart accordingly.
- Flow Direction: Use arrows to indicate the flow of the process, showing the sequence of tasks and decisions.
- Annotations: Include relevant information, notes, or explanations to provide additional context for the process chart.
By including these elements in your process chart, you can create a comprehensive and informative visual representation of the workflow.
Examples
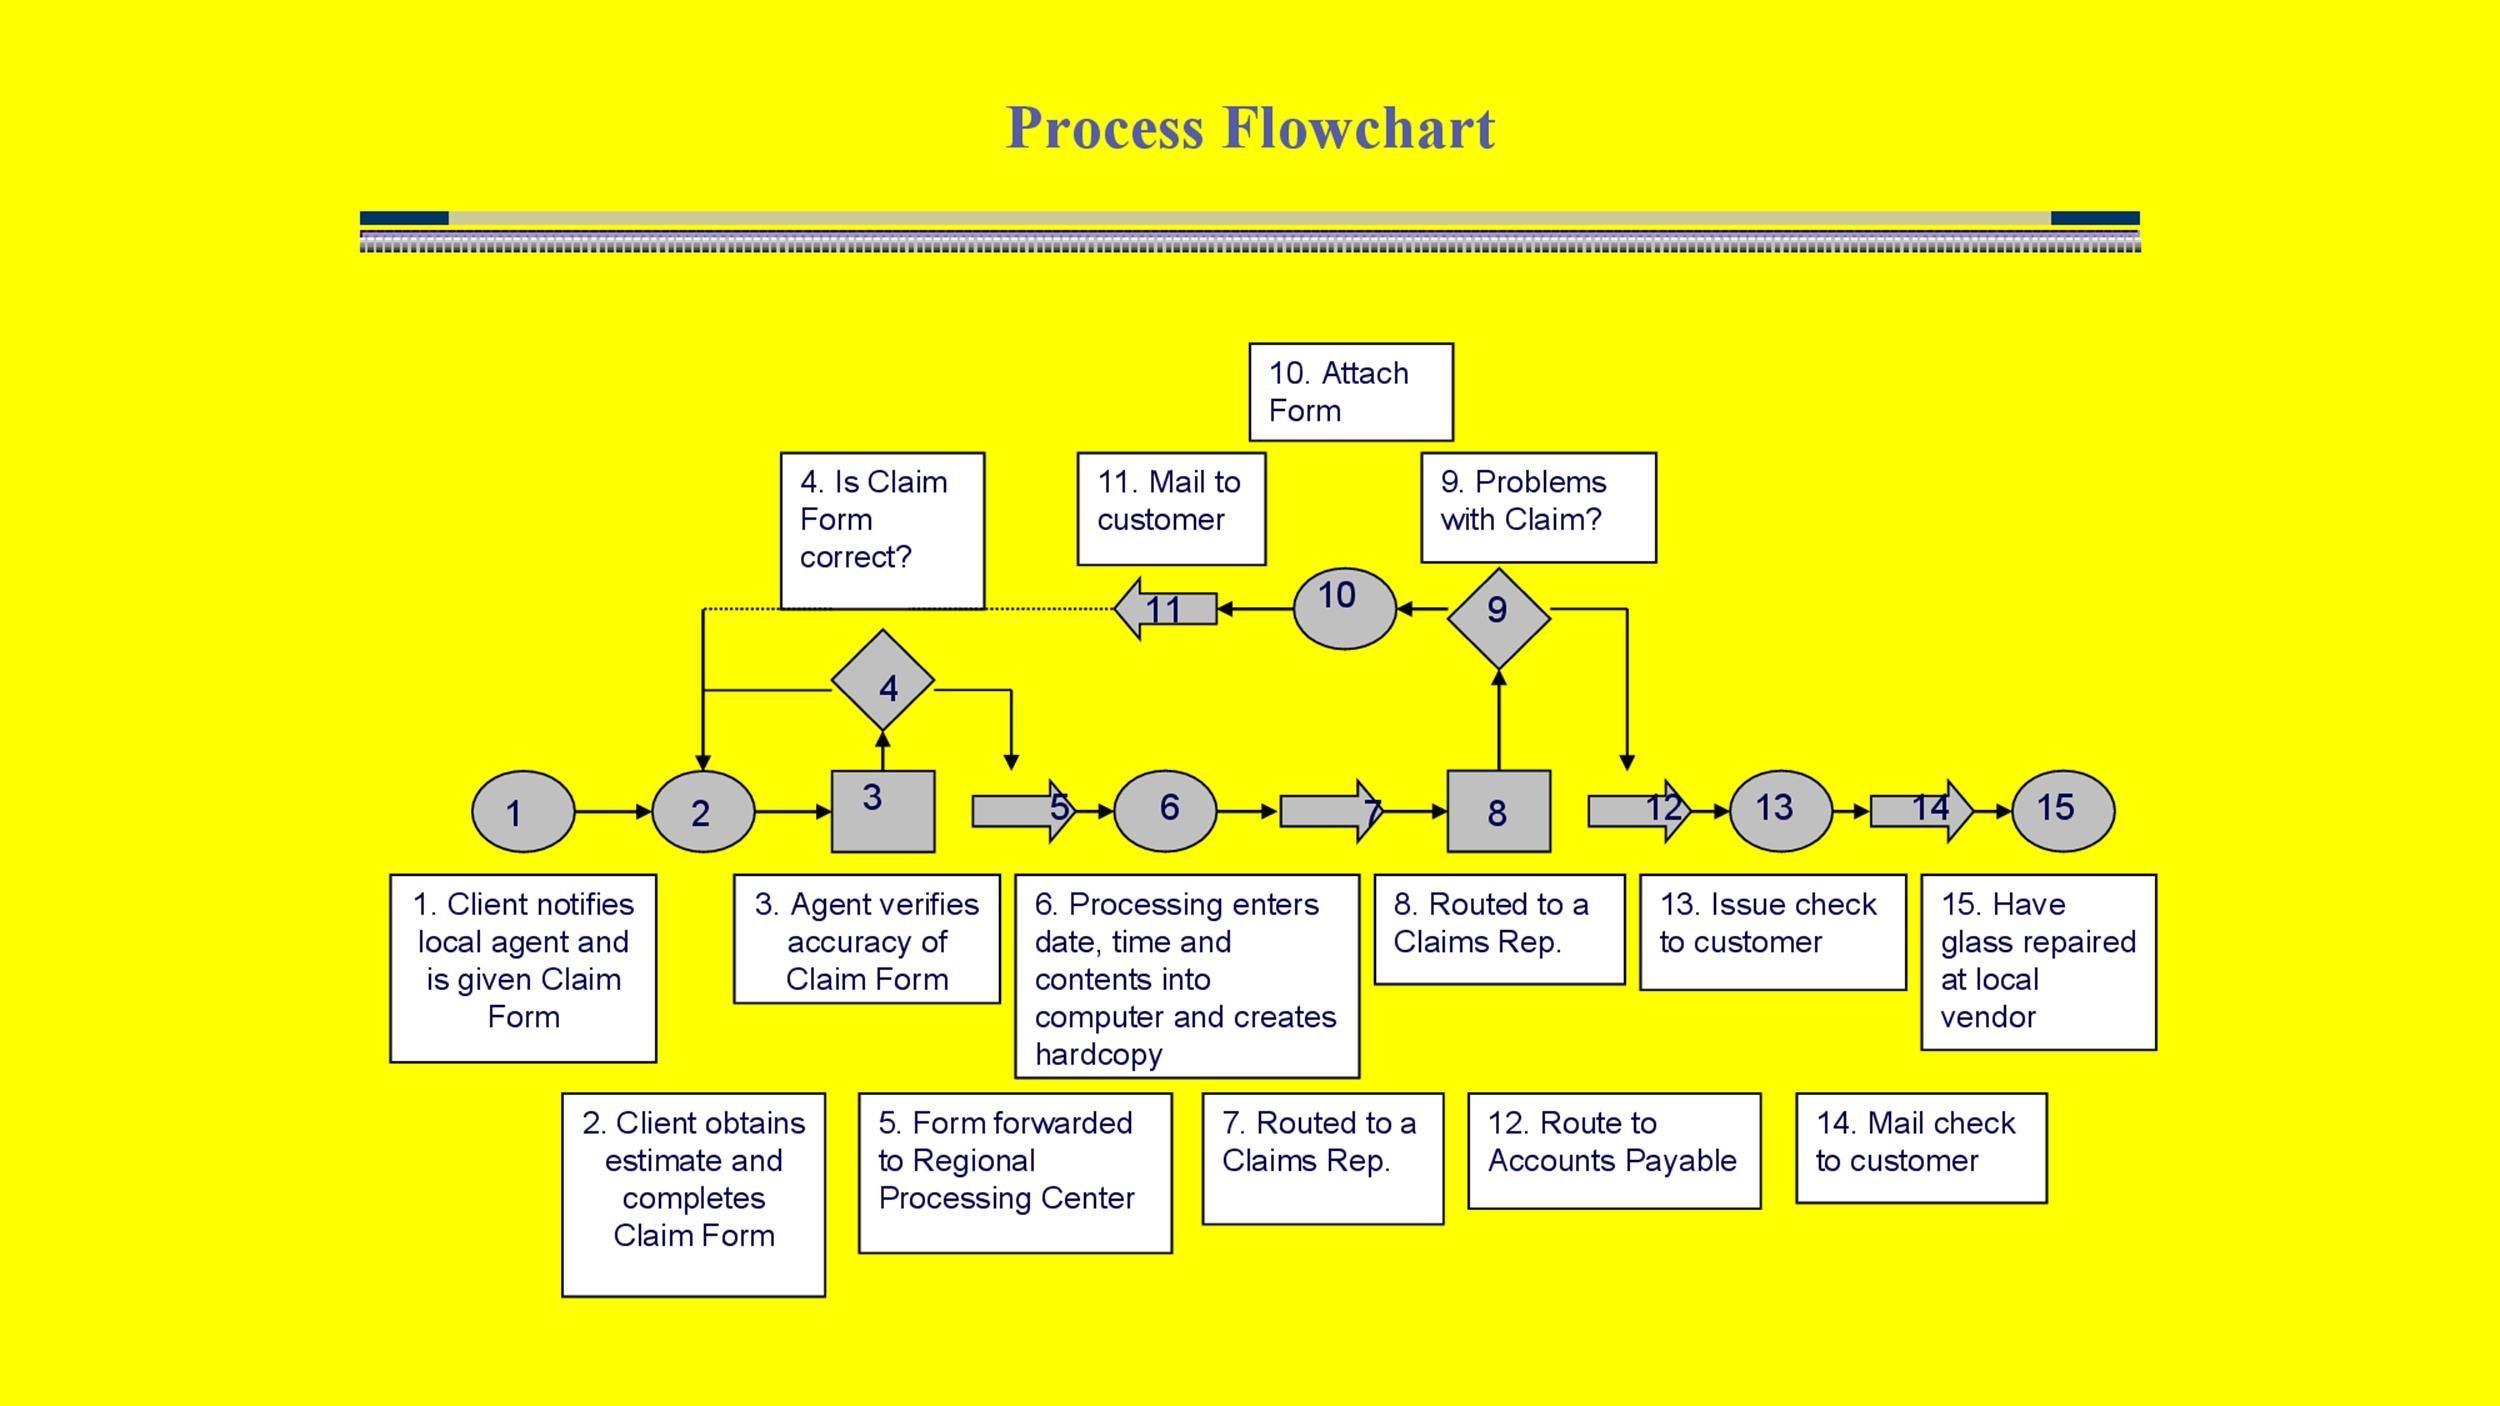
How to Create a Process Chart
Creating a process chart involves several steps to ensure clarity, accuracy, and effectiveness. Follow these guidelines to create a clear and concise process chart for your workflow:
1. Identify the process: Start by defining the process you want to visualize, outlining the steps, tasks, and decision points involved.
2. Determine the type of process chart: Choose the appropriate type of process chart based on the complexity and purpose of the process you are illustrating.
3. Define the start and end points: Clearly indicate where the process begins and ends to provide context for the workflow.
4. Outline the tasks or activities: List the tasks or activities involved in the process in a sequential order, highlighting dependencies and relationships.
5. Identify decision points: Mark decision points where choices need to be made, branching the flowchart accordingly.
6. Use arrows to show the flow: Use arrows to indicate the direction of the process flow, showing the sequence of tasks and decisions.
7. Include annotations: Provide relevant information, notes, or explanations to add context and clarity to the process chart.
By following these steps, you can create a comprehensive process chart that effectively communicates the workflow and enhances understanding among team members.
Tips for Using Process Charts
When utilizing process charts in your organization, consider the following tips to maximize their effectiveness:
- Keep it simple: Avoid unnecessary complexity and focus on capturing the essential steps in the process.
- Use colors and symbols: Use colors and symbols to differentiate between tasks, decisions, and other elements in the process chart.
- Update regularly: Keep your process charts up to date to reflect any changes or improvements in the workflow.
- Solicit feedback: Gather feedback from team members on the clarity and effectiveness of the process charts to make improvements.
- Integrate with other tools: Use process charts in conjunction with other tools such as project management software to streamline operations.
By incorporating these tips into your process charting practices, you can enhance communication, improve efficiency, and drive continuous improvement within your organization.
In conclusion, process charts are invaluable tools for visualizing workflows, improving communication, and enhancing operational efficiency. By understanding the different types of process charts, their benefits, and best practices for creating and using them, organizations can streamline operations, drive continuous improvement, and achieve greater success. Start incorporating process charts into your workflow today and experience the transformative impact they can have on your organization.
Process Chart Template – Download

- Printable Bill of Lading Form Template - October 8, 2026
- Free Behavior Contract Template (Word) - October 8, 2026
- Free Printable Baseball Schedule Template - October 8, 2026
