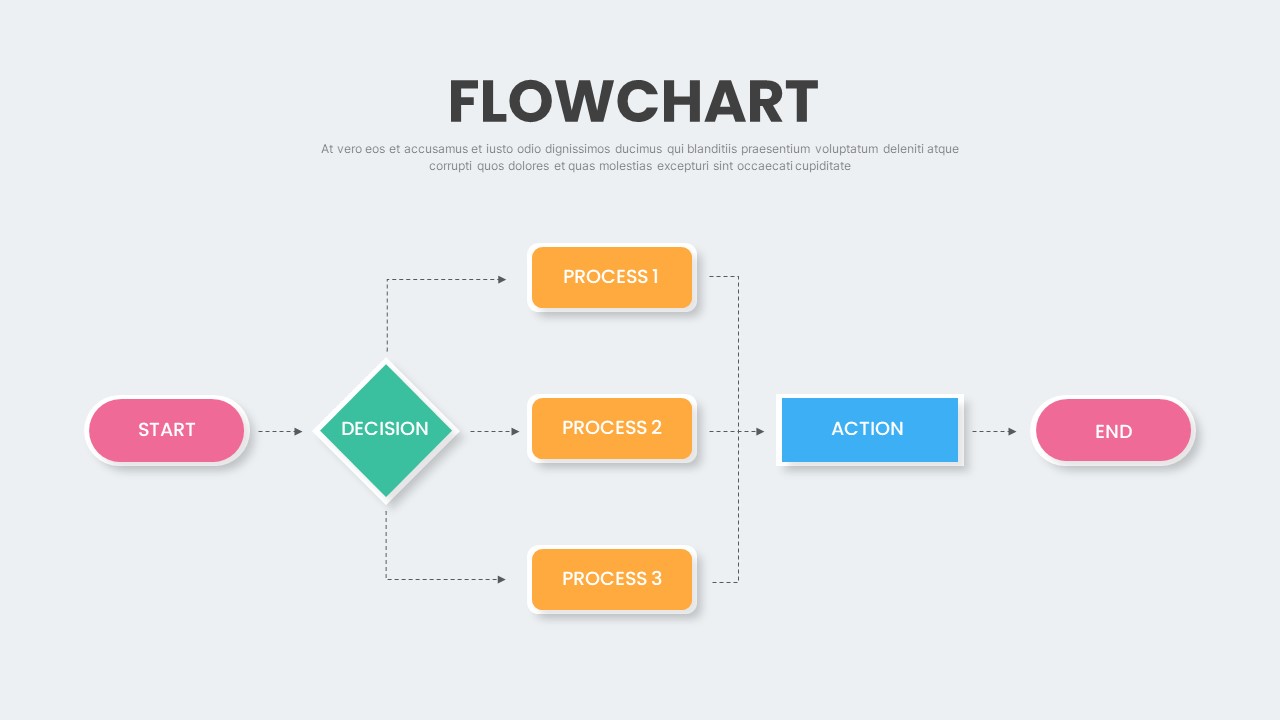
In today’s fast-paced world, efficiency is key to success. Whether you’re a small business owner, a project manager, or simply looking to improve your daily tasks, workflow charts can be a game-changer. By visualizing your processes and identifying bottlenecks, you can streamline your workflow and boost productivity. In this comprehensive guide, we’ll explore everything you need to know about workflow charts, from their definition to key elements and practical tips for creating your own. Let’s dive in!
What is a Workflow Chart?
A workflow chart, also known as a process flowchart or workflow diagram, is a visual representation of a series of steps or activities involved in completing a specific task or project. It provides a clear overview of the entire process, allowing you to identify dependencies, potential issues, and areas for improvement. Workflow charts can be simple or complex, depending on the complexity of the process being depicted.
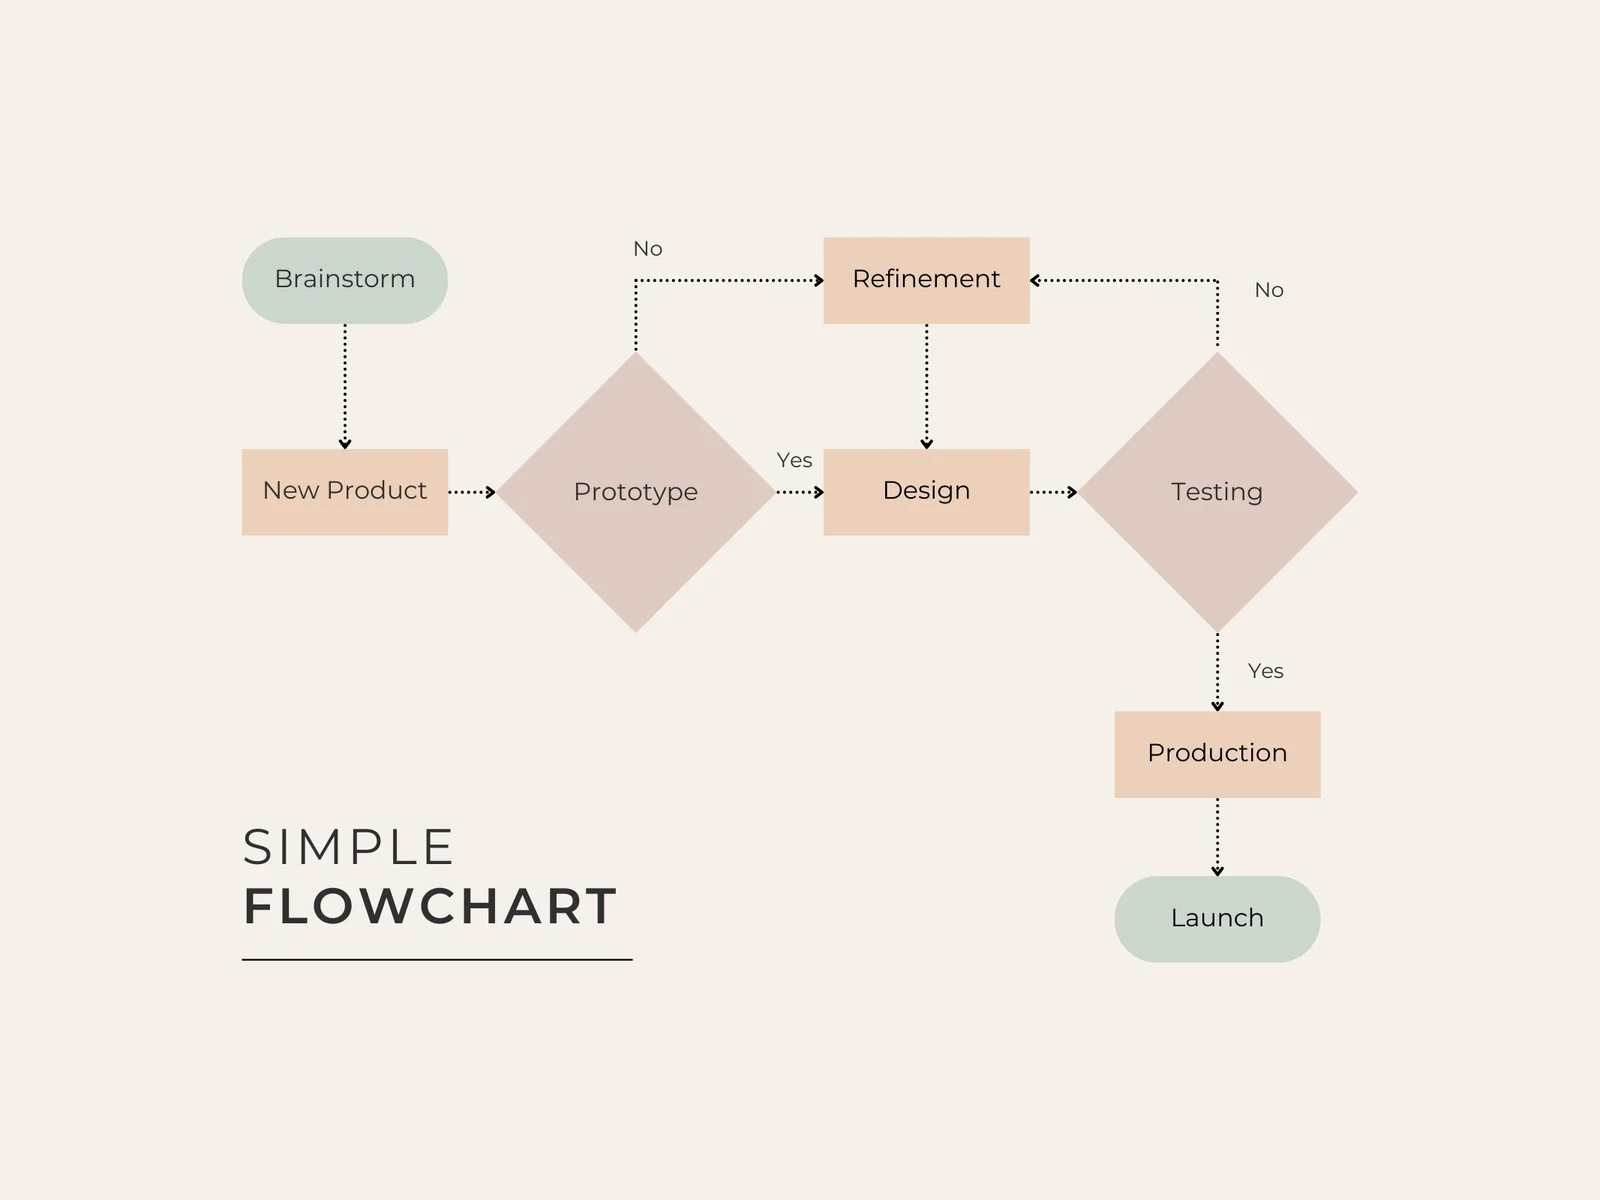
Creating a workflow chart starts with defining the starting point and endpoint of the process. Then, each step or activity is outlined and connected through arrows to show the flow of work. Different shapes and symbols are used to represent different actions, decisions, or outcomes, making it easy to understand the sequence of events.
Why Use Workflow Charts?
Workflow charts offer several benefits for individuals and organizations looking to streamline their processes and improve efficiency. Some of the key advantages of using workflow charts include:
- Clarity: Visualizing the workflow helps to clarify complex processes and make them easier to understand.
- Identifying bottlenecks: By mapping out the steps involved, you can identify bottlenecks or areas of inefficiency that need to be addressed.
- Improving communication: Workflow charts provide a common visual language that can be easily shared and understood by team members, stakeholders, and clients.
- Increasing productivity: Streamlining processes through workflow charts can lead to increased productivity and reduced turnaround times.
- Facilitating decision-making: Having a visual representation of the workflow can help in making informed decisions and prioritizing tasks effectively.
Key Elements of a Workflow Chart
When creating a workflow chart, there are several key elements that you should include to ensure clarity and effectiveness. These elements typically consist of:
- Start and end points: Clearly define where the process begins and ends to provide a clear scope of the workflow.
- Tasks or activities: Outline each step or activity involved in the process, including any decision points or branching paths.
- Flow direction: Use arrows to indicate the sequence of tasks and the direction of the workflow.
- Decision points: Highlight decision points where different paths or outcomes are possible, using decision diamonds or other symbols.
- Connectors: Use connectors to link related tasks or activities, avoiding clutter and ensuring a clear flow of work.
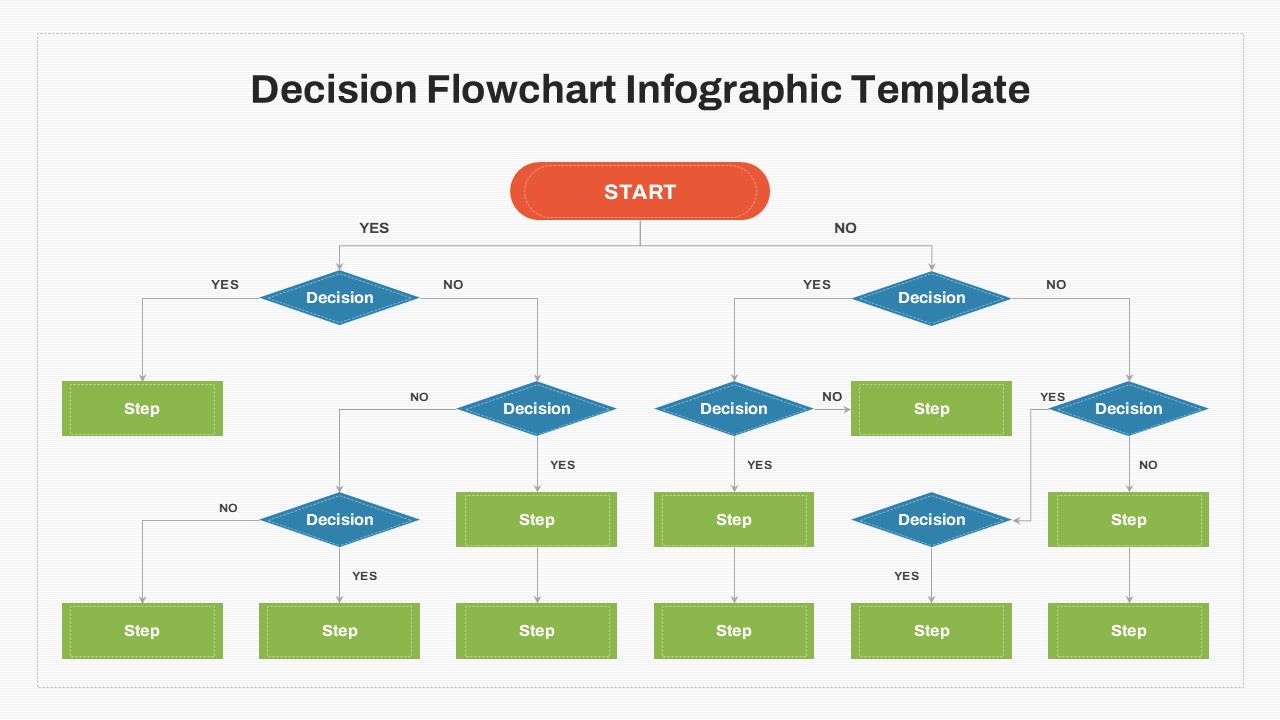
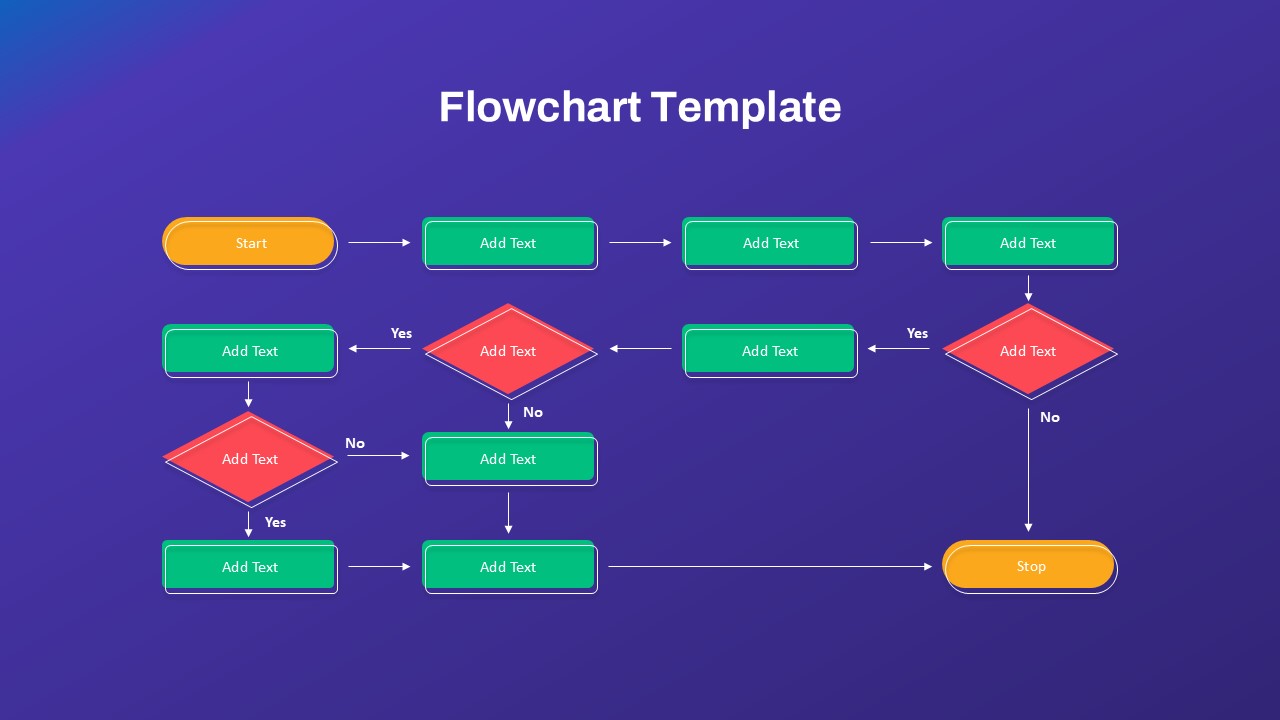
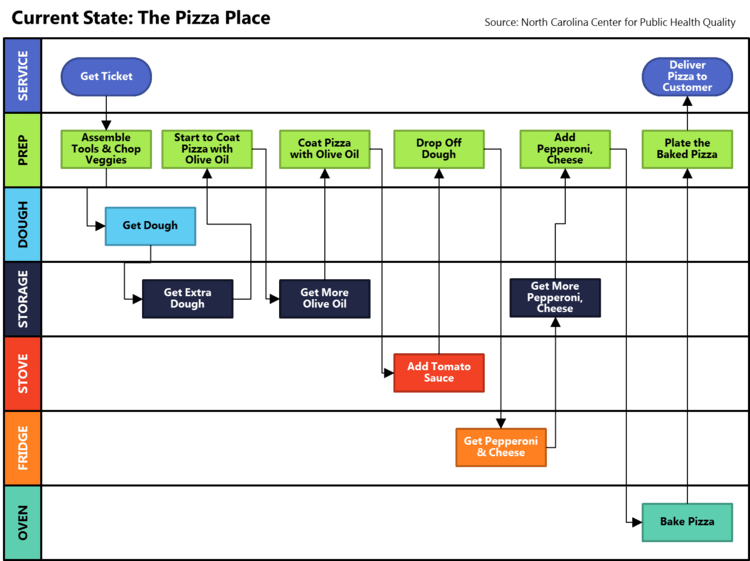
How to Create a Workflow Chart
Creating a workflow chart may seem daunting at first, but with the right approach, anyone can design a clear and effective diagram. Here are some steps to help you create your own workflow chart:
1. Define the process: Clearly outline the steps or activities involved in the process you want to map out.
2. Identify key stakeholders: Involve relevant team members or stakeholders to ensure all perspectives are considered.
3. Choose a tool: Select a software or platform that suits your needs, whether it’s a simple drawing tool or a specialized workflow software.
4. Draw the chart: Start by sketching out the process flow using shapes, symbols, and connectors to represent tasks and relationships.
5. Review and refine: Share the draft with stakeholders for feedback and make any necessary adjustments to improve clarity.
6. Finalize and implement: Once the workflow chart is finalized, use it as a reference guide for executing the process efficiently.
Tips for Effective Workflow Charts
To ensure your workflow chart is clear, concise, and actionable, consider the following tips:
- Simplify where possible: Keep the chart simple and focused on the main steps, avoiding unnecessary details.
- Use consistent symbols: Standardize symbols and colors to represent different actions or outcomes for easy understanding.
- Update regularly: As processes evolve, update your workflow chart to reflect any changes and keep it current.
- Get feedback: Involve team members and stakeholders in the creation process to gather valuable input and ensure buy-in.
- Test the workflow: Implement the workflow chart in practice and gather feedback on its effectiveness in improving processes.
Conclusion
In conclusion, workflow charts are powerful tools for visualizing and optimizing processes in any setting. By creating clear and detailed workflow charts, you can streamline your workflows, improve efficiency, and drive better results. Whether you’re managing a project, running a business, or simply looking to enhance your daily routines, incorporating workflow charts into your workflow can make a significant impact. Start creating your own workflow chart today and experience the benefits of streamlined processes firsthand.

- Free Roommate Agreement Template (Word) - September 28, 2026
- Free Printable Wedding Card Template - September 28, 2026
- Free Printable Wedding Schedule Template - September 28, 2026
